Overview
Having studied and taught martial arts and self-defense for more than a decade, I have long been wondering about gun violence in the United States. It seems like I hear about someone getting killed or injured because of a gun every single day. Living in Chicago and having grown up in Baltimore, I am often exposed (daily; sometimes multiple times per day) to news reports about gang violence involving guns, and I am curious about how these cities compare to other places in the United States.
In particular, I am also very interested in formulating effective solutions to decrease gun violence. In the last decade or so, the conversation around guns has morphed into a bitter, partisan argument between staunch supporters of the second amendment (the political right), and staunch opposition to all guns, especially so-called “assault rifles” (the political left).
Between both sides twisting facts (or getting them completely wrong) and spewing rhetoric to support their own agenda with no desire to compromise, it is difficult for those like me in the middle to truly grasp the depth of the problem and come up with reasonable solutions that are independent of ideology, but still take into consideration the political realities of living in a country with more guns than people.
In this first analysis, I attempt to look at gun violence in the United States to understand the differences between states as well as cities. I attempt to find trends between the number of gun laws and the gun violence casualty rate (defined as number of people injured or killed in a particular crime).
Overall, it does not appear that there is any correlation between the number of gun laws in a particular state and the gun violence casualty rate. It is possible that legislation does curb gun crime in particular cities, but further investigation is needed to understand exactly what types of laws are effective, and why they are effective in a particular location. It is not necessarily true that laws that are effective in, for example, New York City would be effective (or even necessary) in a city like White Plains, NY.
A brief statement about methodology:
The data are from the Gun Violence Archive and were downloaded from Kaggle on May 12, 2018. The data used are from 2014-2017.
The dataset was cleaned to remove suicides, incidents involving replica weapons, and officer involved shootings. A full overview of the R code I used to analyze the data and generate the plots can be accessed on RPubs, and the Github repository can be accessed here.
Let’s take a look at the data. First, we’d like to know how many gun fatalities, injuries, and overall casualties (fatalities + injuries) there were on average from 2014-2017:
## casualties fatalities   injuries
##   38528.00   12287.25   26240.75
Over 38,000 people per year were either killed (12,000+) or injured (26,000+) by a firearm from 2014-2017. That’s a little over 100 people each day, and does not include victims of suicide (which are substantial).
Most Dangerous States Per Capita
In order to find the per capita casualty rate for all 50 states, I got census data for each state from 2010-2017 from the U.S. Census Bureau, and then normalized the annual casualty rates for each state by the population (per hundred thousand people). So, for each state there were four entries: 2014, 2015, 2016, and 2017. To make plotting a little simpler, I’ll just show the mean of each per capita casualty rate for each state from 2014-2017.
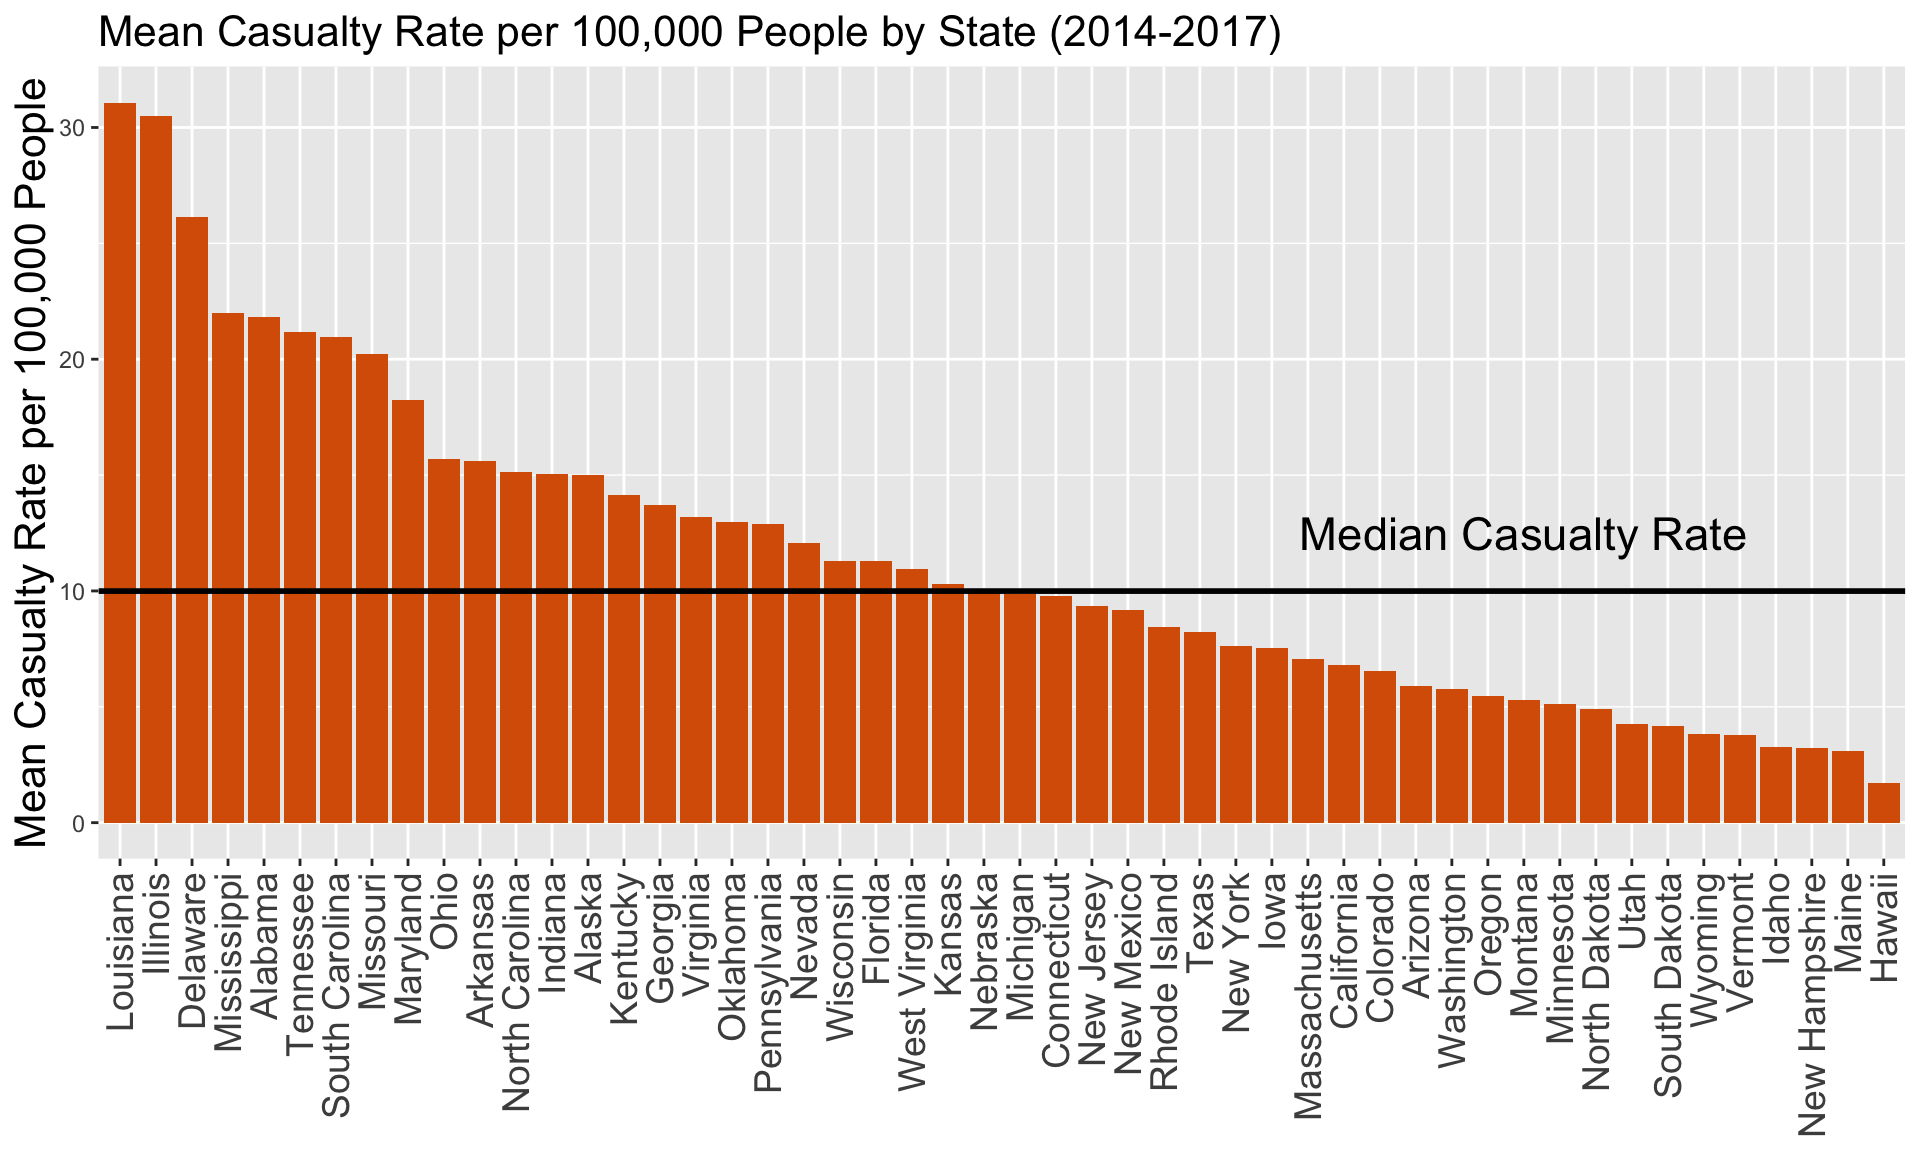
The black line represents the median casualty rate for all 50 states. The top 5 states with the highest per capita casualty rate are Louisiana, Illinois, Delaware, Mississippi, and Alabama.
Here is a heat map of the state casualty rates in the US:
Most Dangerous Cities Per Capita
Let’s now look at the cities with the highest rates of per capita gun violence. I again used data from the U.S. Census Bureau to find the population of cities in the United States. The dataset I used contained data from 2010-2016 for all cities greater than 50,000 residents. Since there were no population data for 2017, I just used the population values from 2016 and assumed there wouldn’t be any significant changes.
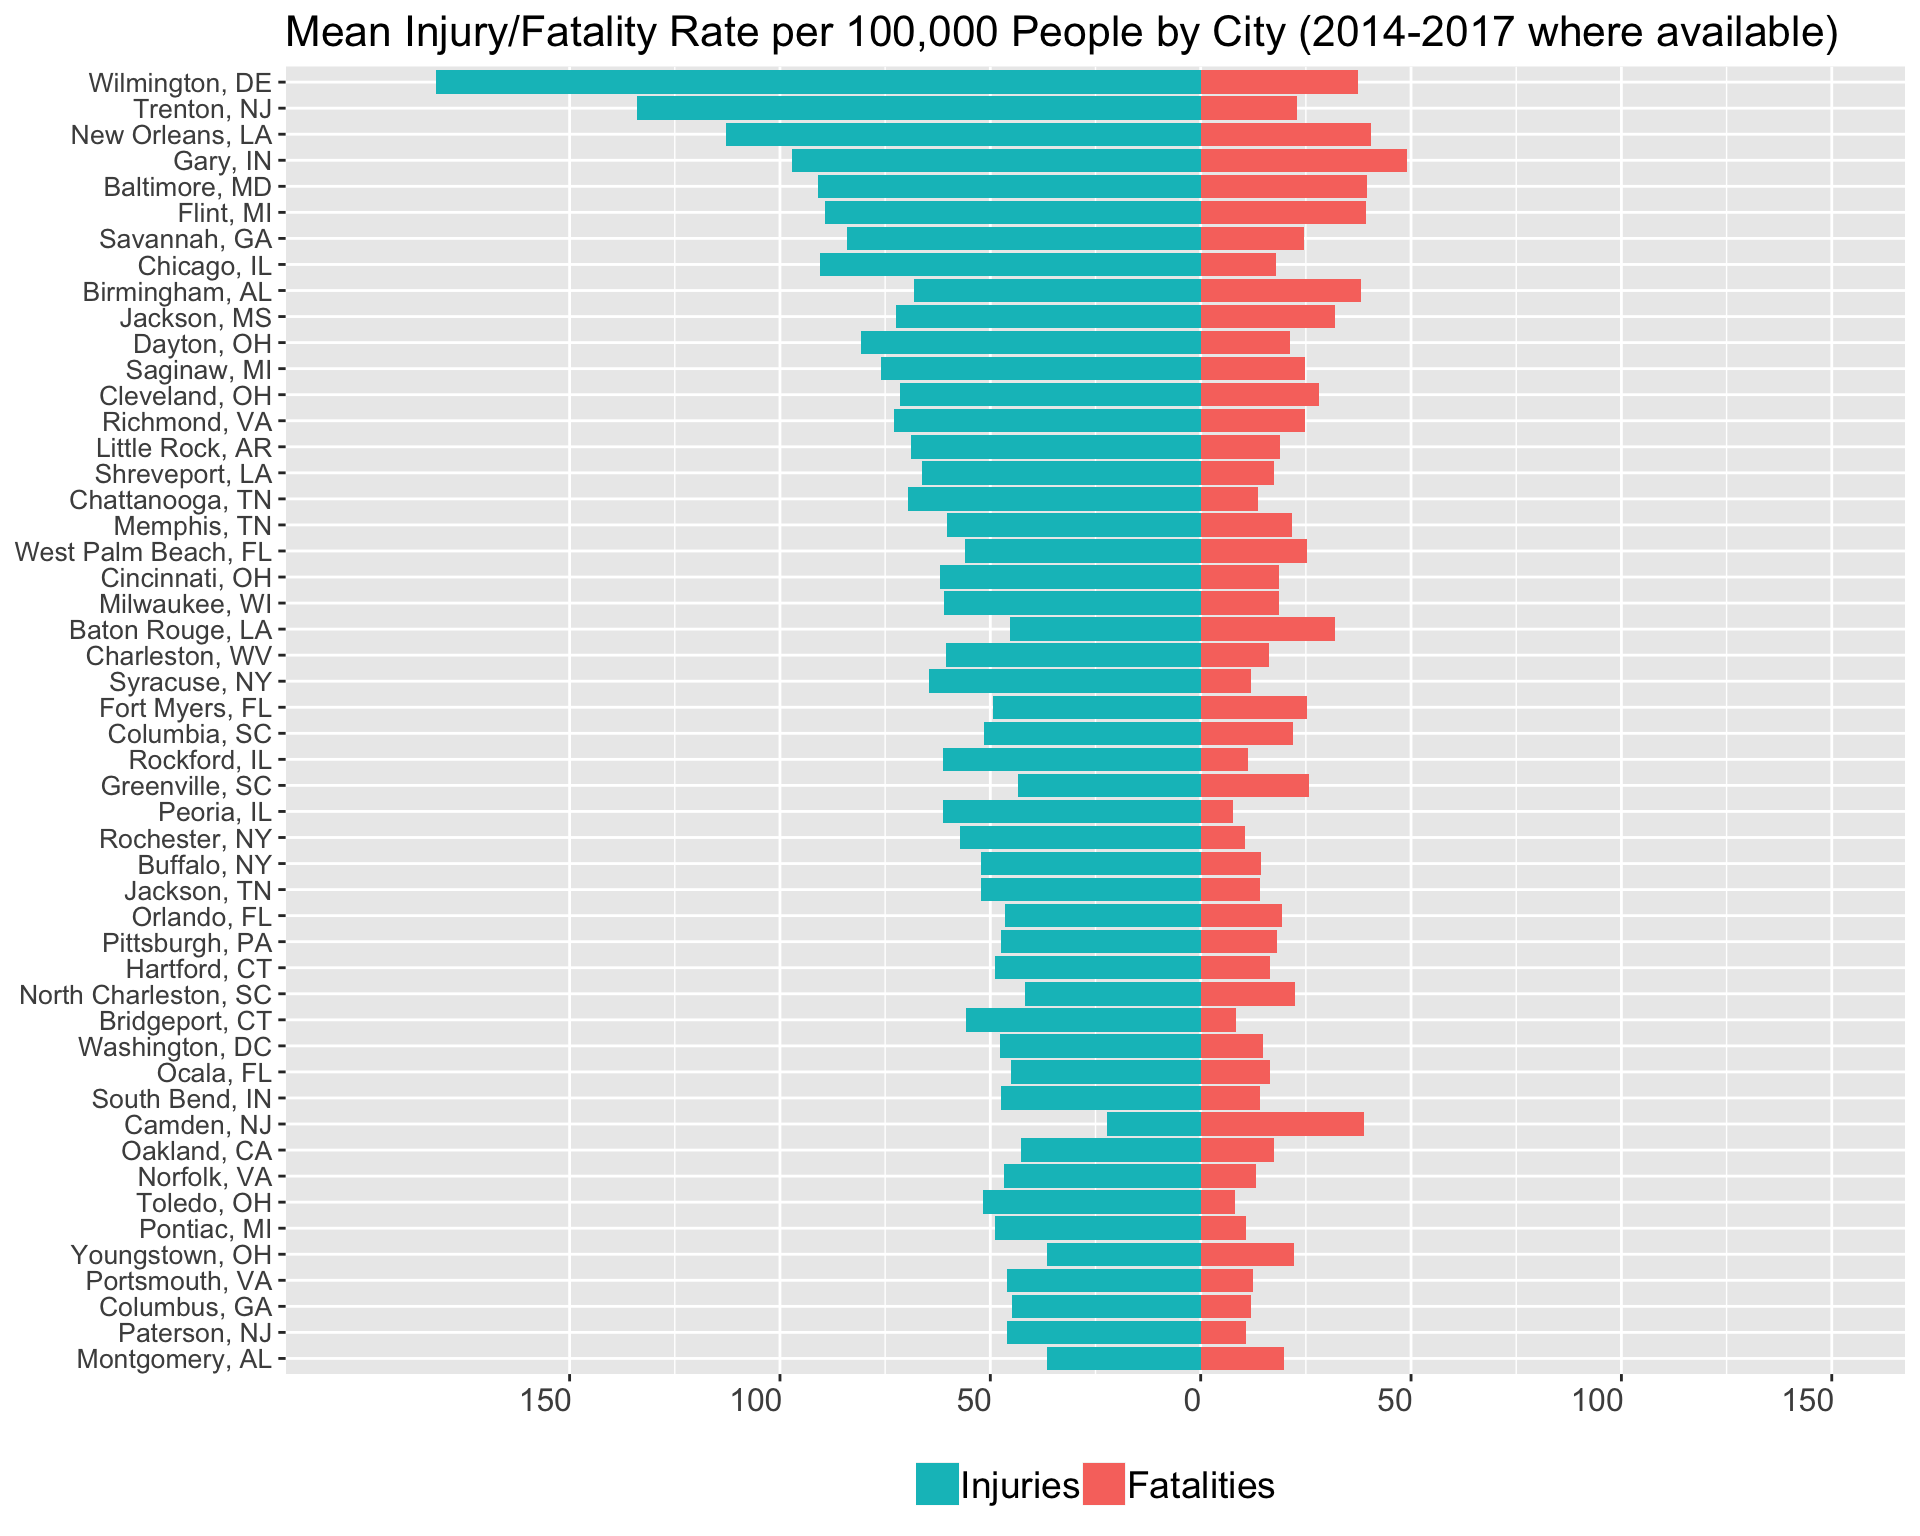
According to the data, the top 5 cities with the most gun violence are:
- Wilmington, DE
- Trenton, NJ
- New Orleans, LA
- Gary, IN
- Baltimore, MD
Both Chicago and Baltimore are in the top 10 most dangerous cities per capita (Chicago comes in at 8th), which does explain why I have been constantly exposed to news reports about gun violence.
Most surprising to me is that Wilmington, DE is the most dangerous city per capita in the United States. This city is not one most people think of when it comes to gun violence, but there has been some press coverage about it.
Wilmington, Trenton, and Gary all have relatively small populations (less than 85,000 people), but a relatively high number of casualties for 2014-2017, which explains their high per capita casualty rates.
Another interesting fact is that the top two most dangerous cities, Wilmington, DE and Trenton, NJ are only about 60 miles away from each other. This is probably not a coincidence - there must be common problems in these two cities.
Effect of Gun Legislation on Gun Casualty Rates
One topic that is furiously being debated across the nation is whether or not to pass more/stricter gun laws on top of the ones that already exist. It seems that with every new mass shooting that makes the news, there is always talk about passing new legislation banning certain types of weapons or tightening requirements for background checks.
What is the effect of gun laws on casualty rates? Let’s analyze this both at the state level and city level.
By State
The data about state laws were downloaded from the State Firearm Law Database. For a first pass, all we are looking at is the absolute number of laws on the books in each state. For simplicity, we assume that each law is as effective as the next (although that is probably not completely true, and each law’s effectiveness most likely varies across each state/municipality and has a number of confounding variables).
Let’s look at the distribution of the number of laws on the books for all 50 states:
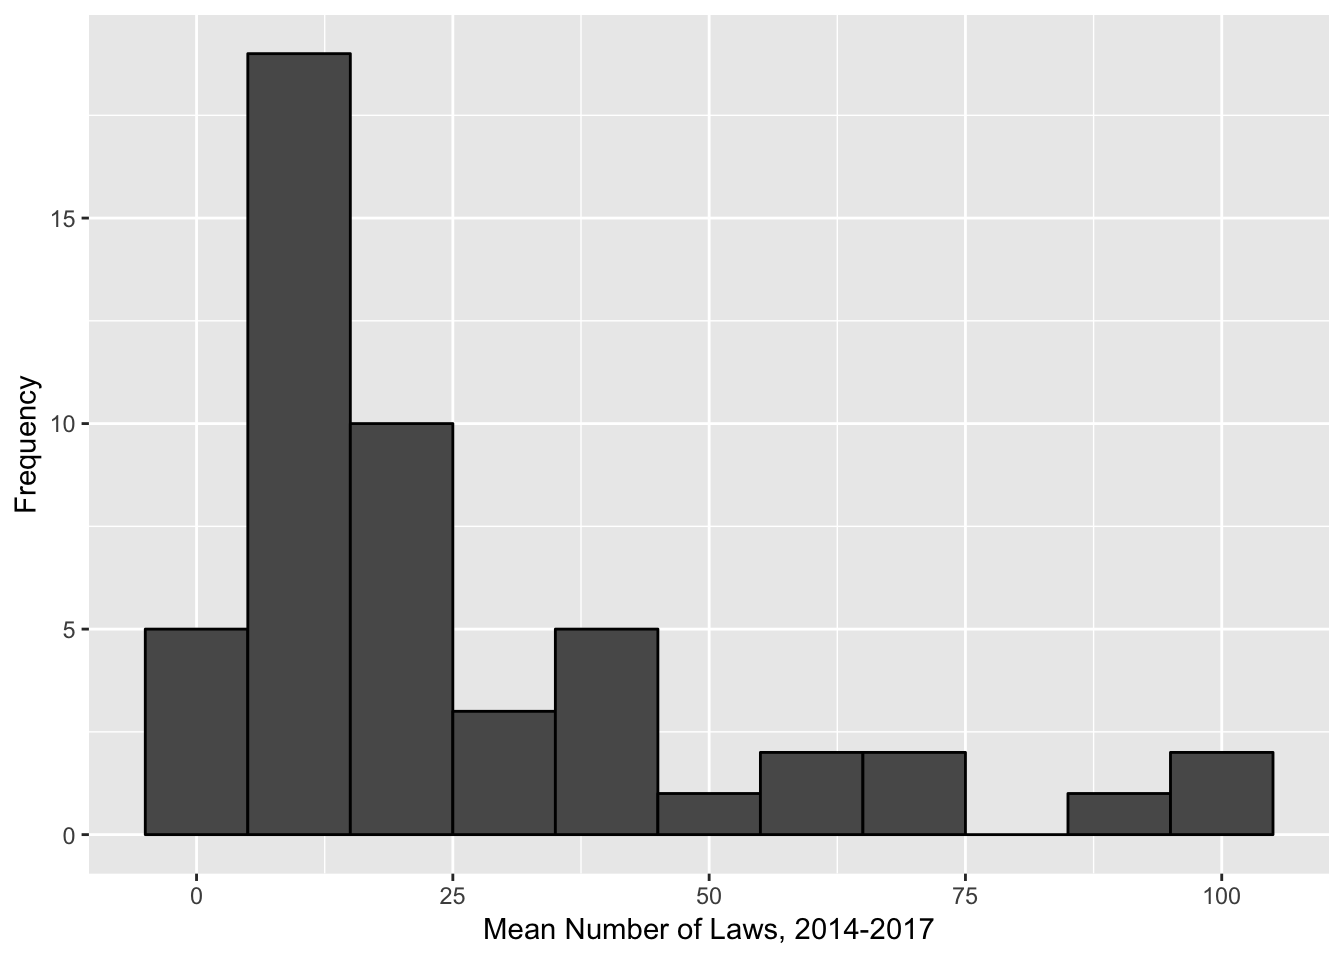
Half the states have around 15 or fewer laws on the books, with the average number of laws being around 25. Is there a correlation between the number of laws in each state and their mean per capita casualty rate?
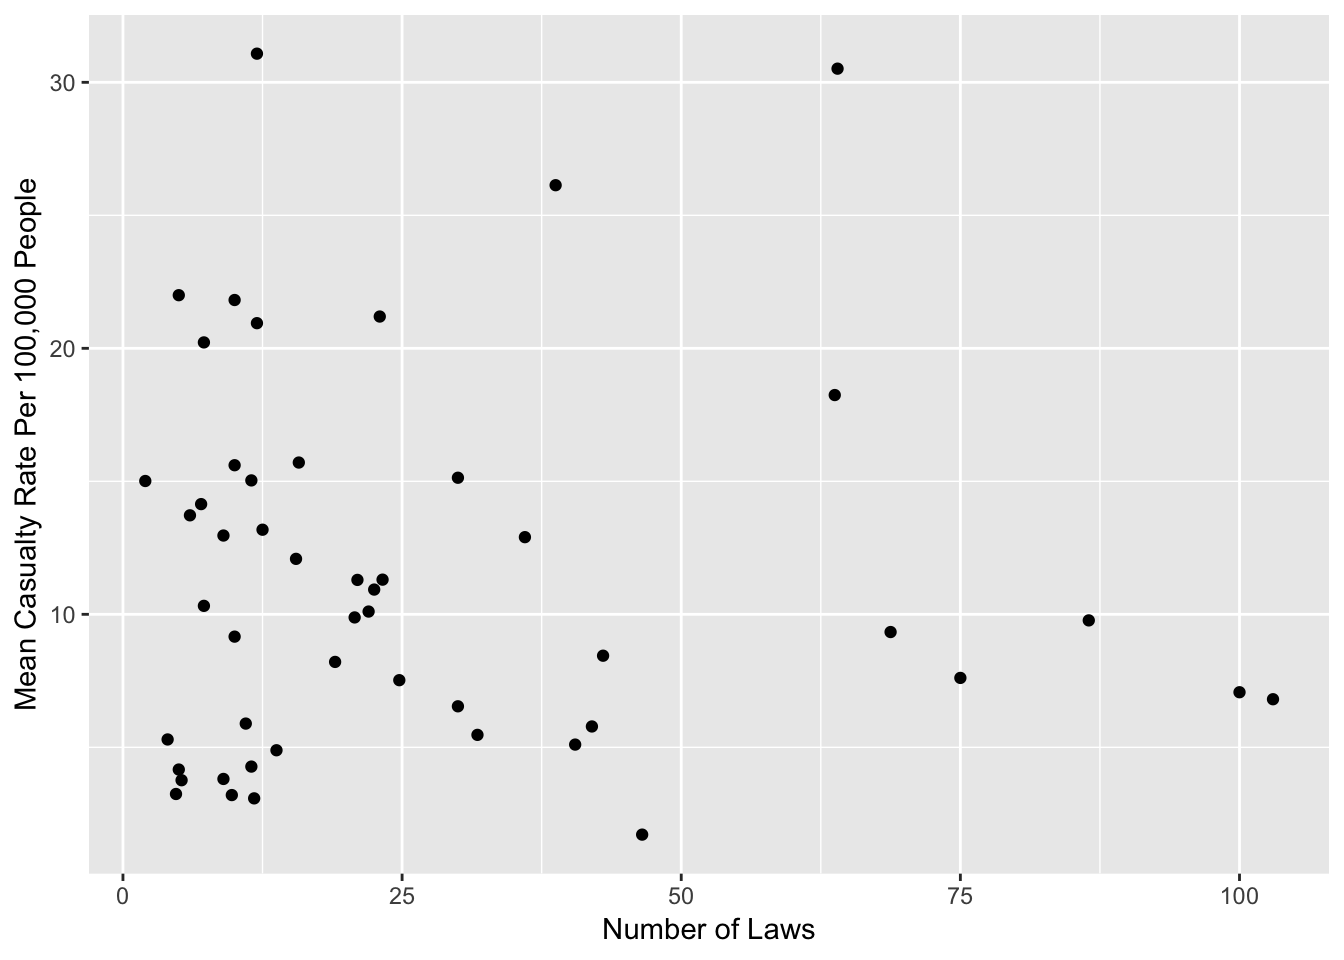
It doesn’t appear so. Some states have few laws on the books and have a lower casualty rate, whereas others achieve the low casualty rate with a higher-than-average number of laws. There are also many states with a high casualty rate and few laws. It could be argued that the states with more laws would actually be more violent if the laws didn’t exist, but it is difficult to make that conclusion.
Let’s look at how each state ranks in terms of casualty rate and the number of gun laws:
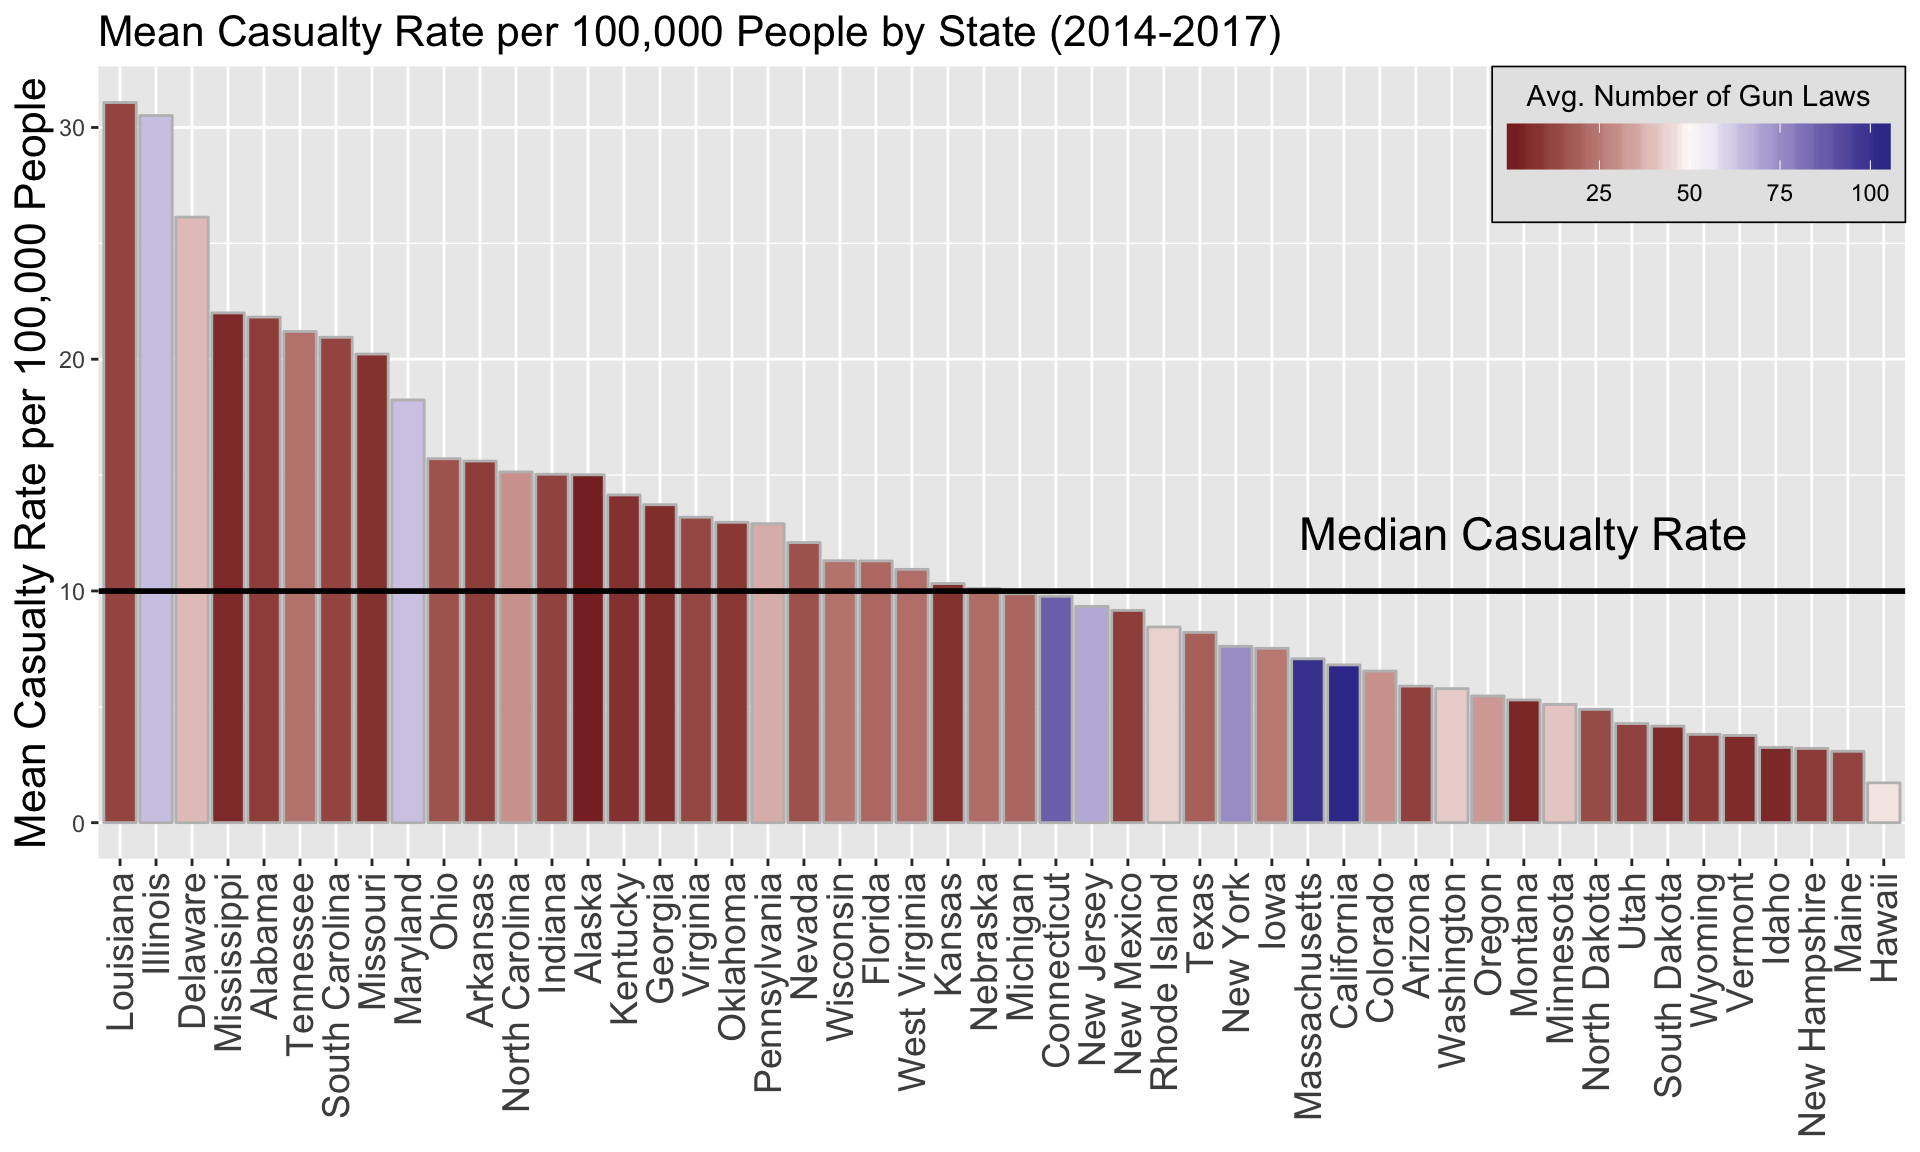
The top 7 states with the highest average number of laws from 2014-2017 are California (103), Massachusetts (100), Connecticut (86.5), New York (75), New Jersey (68.8), and Illinois (64). Of these seven, two states are above the median casualty rate for the US (Illinois and Maryland) - the other five rank a little below the median rate.
There may be a weak association between number of laws and state casualty rate, but there are probably other factors at play as well, such as population density. There are a number of states below and above the median casualty rate with fewer gun laws, so it is difficult to conclude that more gun laws translate to less gun violence. Instead, high rates of gun violence probably have more to do with other factors, such as gang activity, poverty, wealth inequality, etc., instead of a lack of legislation.
By City
Let’s look at the data by city and try to figure out if there is a correlation between the number of laws in a particular state and the per capita casualty rates for cities in that state:
There are 736 cities displayed here (there are actually a lot more cities throughout the US where gun violence occurred, but the population data were only available for cities over 50,000 people). It is clear that in a given state, there is a wide distribution in the casualty rates. You can use your mouse to hover over each point to see the data it represents.
Unsurprisingly, it is clear that individual states experience different levels of gun violence in different cities. Let’s look at a box plot in order to see the distribution in city casualty rates in each state:
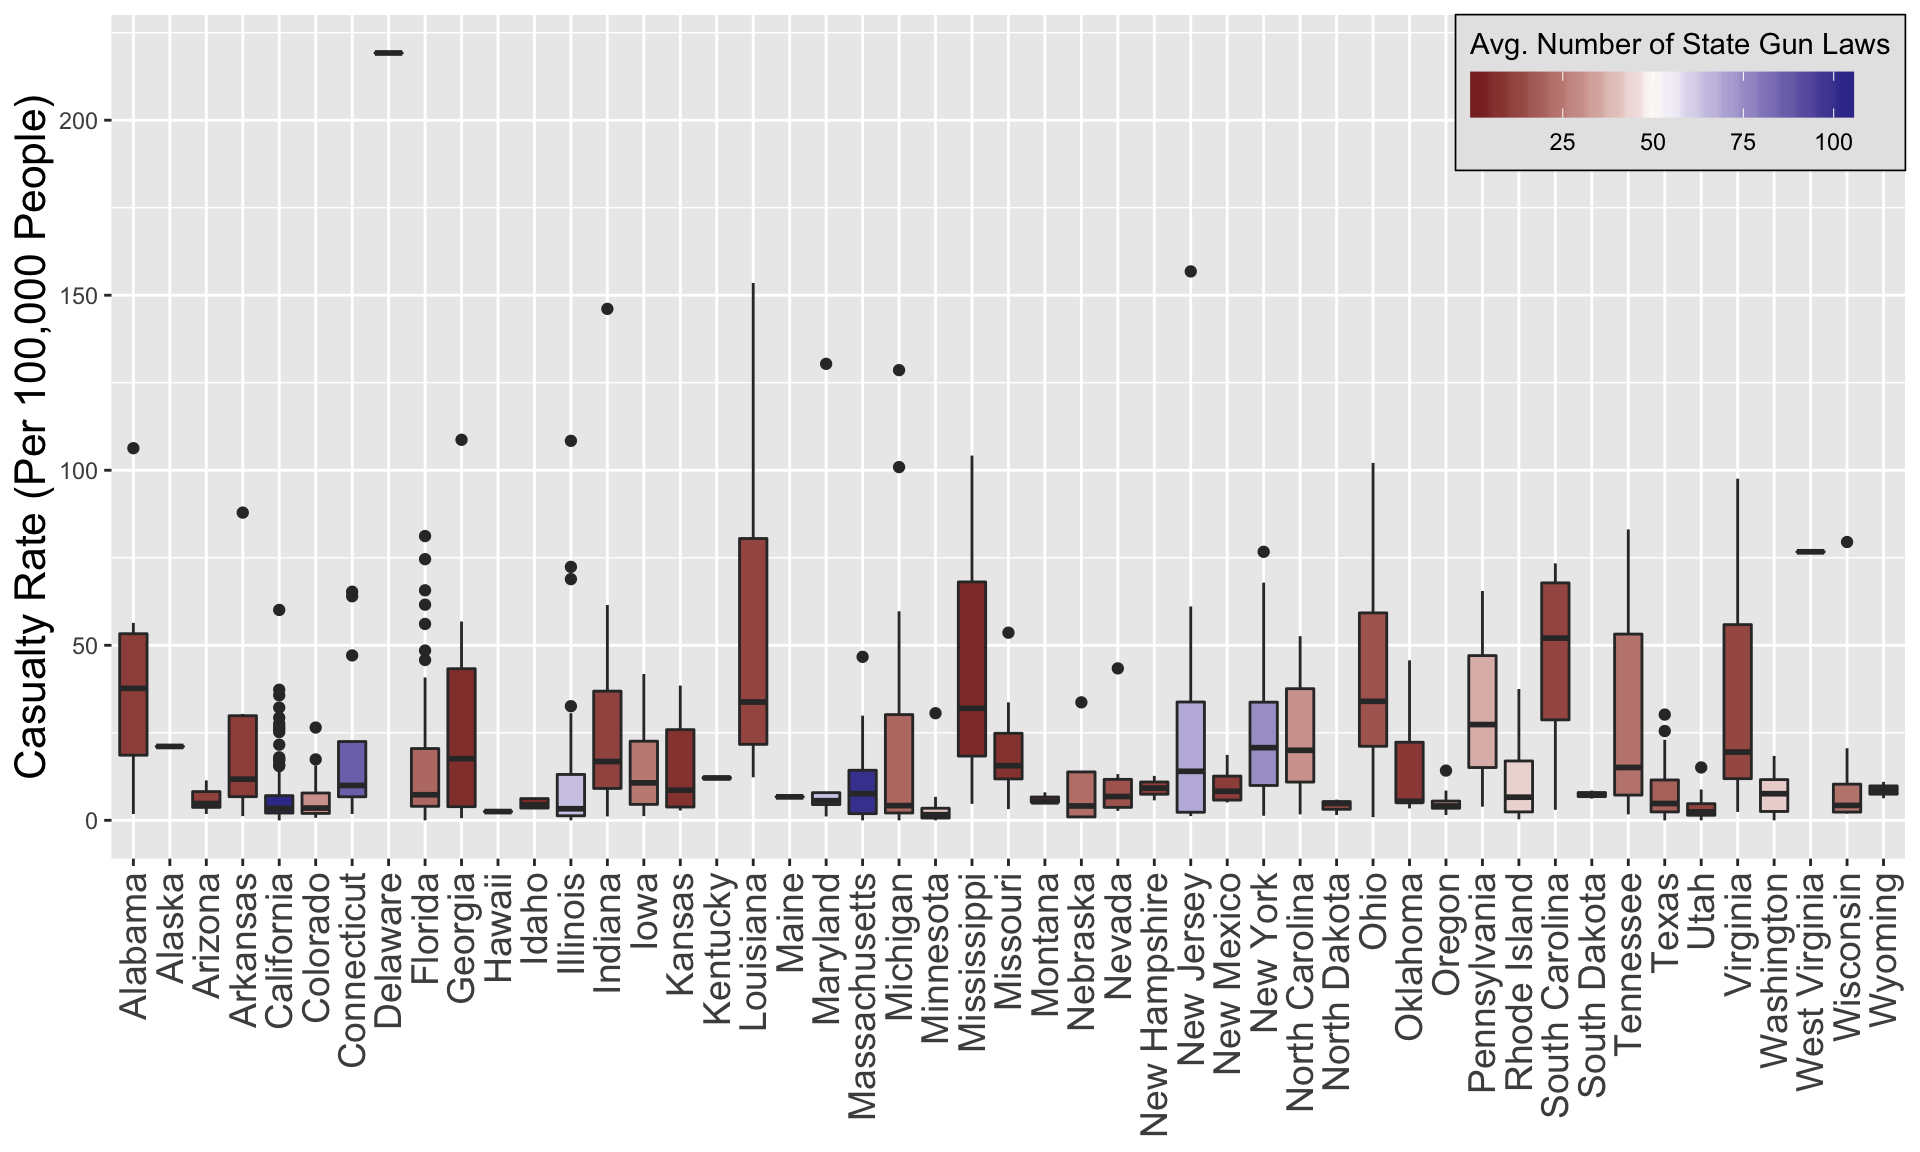
It doesn’t appear that there is any trend between the distribution of casualty rates and the number of gun laws in a particular state. Some states with many gun laws (like Maryland) have an extremely small distribution, but one significant outlier (Baltimore). Other states like Mississippi and Louisiana have a large distribution in gun casualty rates across their cities.
Now let’s take another look at the injury/fatality rates for the Top 49 cities with the highest rates of gun casualty, this time colored by number of state laws. These are the same cities as those in the Top 50 rank we did earlier, except we’ve excluded Washington, DC.
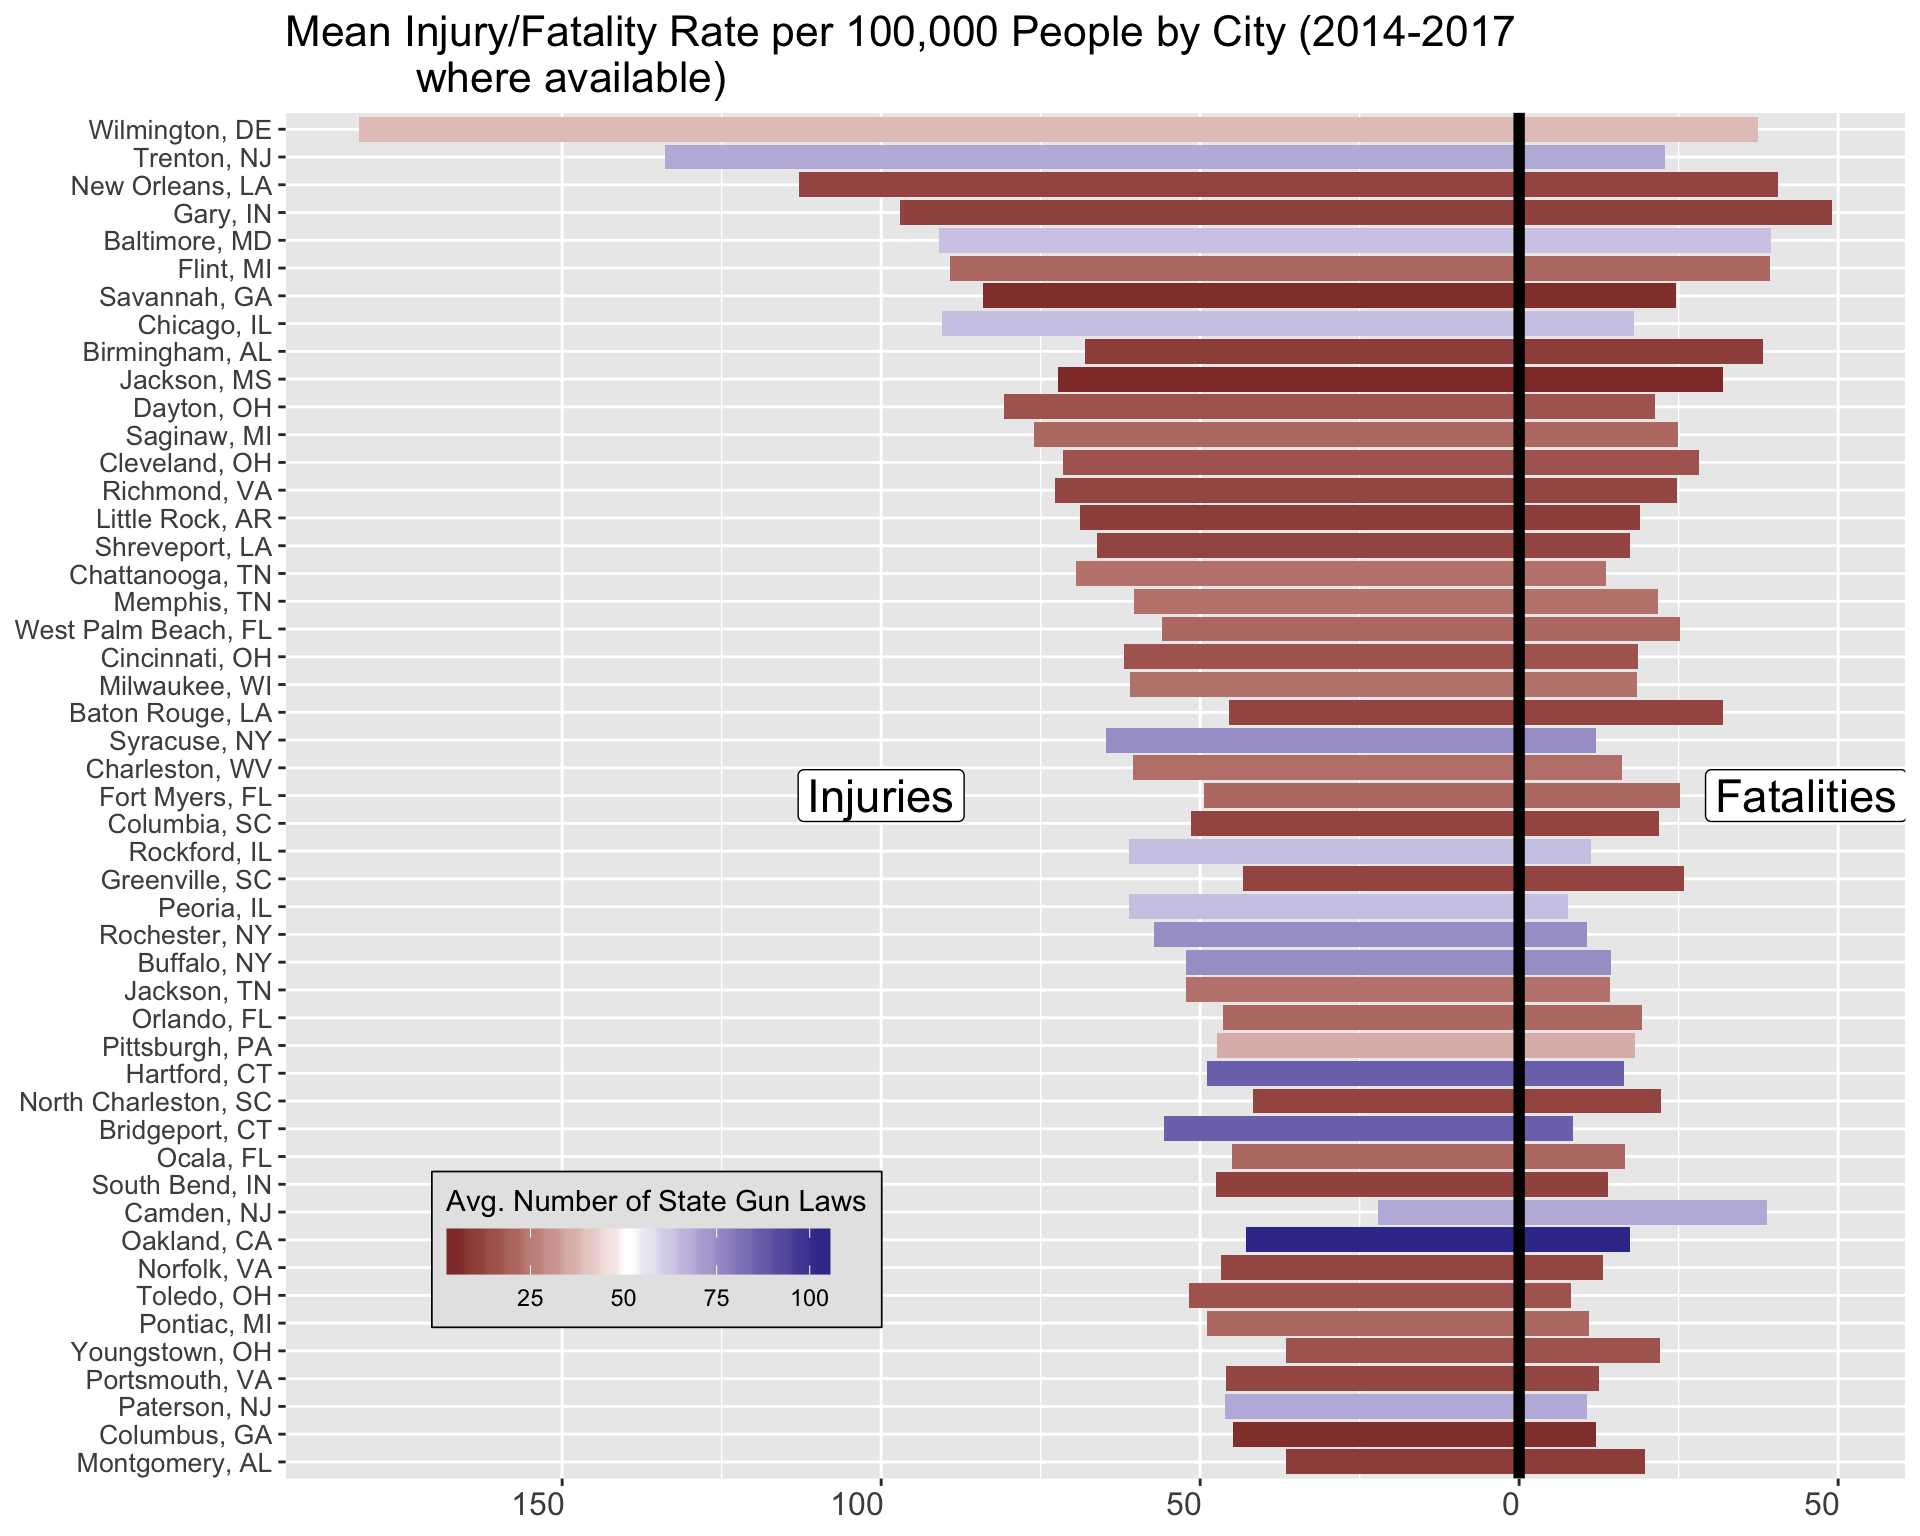
Three of the top ten most dangerous cities (Trenton, Baltimore, and Chicago) are among the states with the most gun laws (New Jersey, Maryland, and Illinois, respectively). How can this be?
It is important to note that individual city laws are not considered here. For example, New York City has an average casualty rate of 8.5 per 100,000 people for 2014-2017. It is one of the MOST POPULOUS cities in the US, yet has a below-average rate of gun casualties. It also has some of the strictest laws. For comparison, Chicago is another densely populated US City and has an average casualty rate of 110 per 100,000 people. That is almost 13 times as dangerous as NYC! Perhaps the cause of this discrepancy is the difference in gun laws for each city. Or, maybe it’s a difference in penalties for each violation, availability of black market firearms, effectiveness of the judicial system in punishing offenders, or a mixture of all of these factors and more.
Summary & Recommendations
Gun violence in the US is an extremely complex problem, and formulating effective solutions will require significantly more detailed analysis. It is hard to discern any relationship between gun violence in states/cities and the number of state gun laws on the books. However, it does not appear that the number of state gun laws has a strong effect on gun violence in individual cities.
In order to make a more solid conclusion, gun violence should be studied at a more local level (i.e., by city or municipality). Individual cities have unique challenges, and there is no one-size-fits-all approach that can be applied to those problems.
For further analysis, it would be interesting to analyze the correlation between gun casualties and different factors such as:
- Wealth inequality
- Poverty
- Unemployment
- Penalties for committing gun crimes
- Gang presence
- Illegal drug market
- Education
- Population density
It would also be worthwhile to analyze how gun laws passed in individual states and/or cities have affected gun crimes in those locales over time.
There is a lot of work to do - more than I can do in my spare time! Perhaps I will tackle one of these projects in the future. Until then, I would love to hear your thoughts, so feel free to share and/or leave a comment below.